Media platforms offer so many different data points to their advertisers that it can be easy for marketers to lose sight of which metrics are important to follow. And without properly assessing your ads’ performance data, you won’t have a clear picture of whether or not your ads are performing as intended. But that’s where we’re here to help!
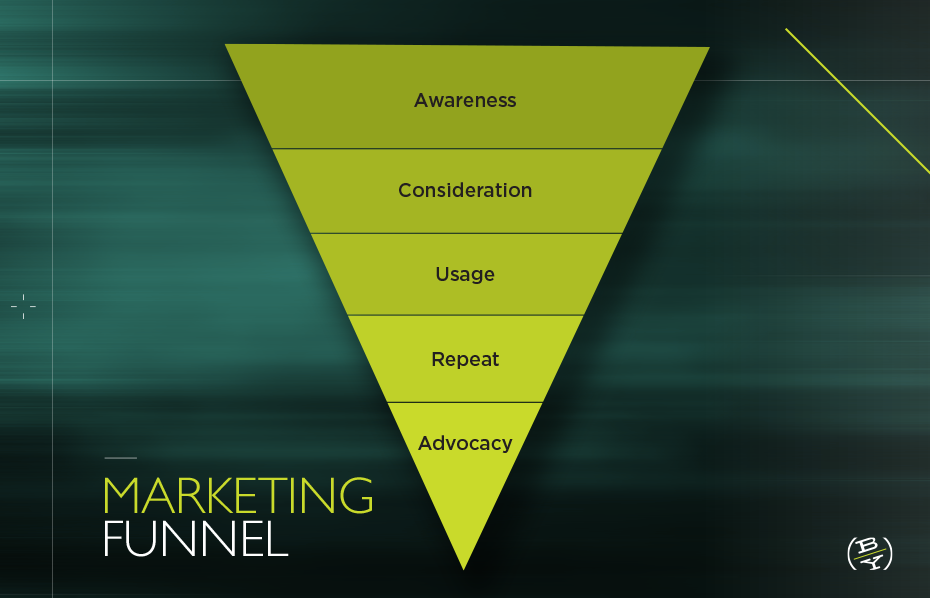
Following the right key performance indicators (KPIs) can help you make better decisions about your marketing and advertising spend. To help you sort through this data overload and have a more accurate picture of your brand health, we’re going to walk you through valuable KPIs to track during three key stages of the marketing funnel.
The Awareness Stage
Let’s start at the top of the funnel in the awareness stage. This is where you start building brand awareness to an audience who may have never heard of your brand, products or services before. The types of media often used here are broadcast TV and radio, streaming video and audio, paid social, print, out-of-home and display advertising.
Like the name of this stage states, the goal at the top of the funnel is awareness. Therefore, you’ll want to track KPIs that indicate how many individuals have seen your ads and if those ads are sticking in consumers’ minds.
Therefore, good awareness stage KPIs to track are impressions, reach and recall. Impressions tell you the number of times your ad has been viewed, and this metric can be tracked for most media. Reach is similar, but this metric tells you the number of unique individuals who encountered your ad. Some digital and broadcast platforms will be able to provide reach metrics.
Now that you know how many consumers have viewed your ad, next you need to see if they remember your brand. This is called recall and it is measured through quantitative research studies. To test if consumers can recall your brand, you can run your own online surveys or use the help of an outside consultant.
The Consideration Stage
Once consumers are in the consideration stage of the funnel, they are gathering more information about your brand to see if you are a fit for their needs. Media employed for this stage includes paid channels like broadcast TV and radio, streaming video and audio, paid social and print as well as owned channels like your company’s website, organic social media and email campaigns.
The success metrics for this stage should show that consumers are, indeed, considering your brand. Does their behavior indicate wanting to learn more or stay in touch?
Here are the KPIs to look for at this stage:
- Click-through rate
- Form fills
- Time on page
- Number of pages visited
- Phone calls
- Social engagement
- Preference
In this stage, you’ll want to get a little more nuanced with your KPIs depending on your industry and goals. How do you want customers to engage with you? For example, if you are a service-oriented company, you might prioritize form fills or phone calls over other metrics, as these generate leads for your sales team to follow up on. Or if you are an online retailer, a long time spent on a product page may be a strong indication of a consumer thoughtfully considering your product.
If you are conducting a brand health survey, preference is also a good metric to quiz consumers on. Are you their preferred brand? It can be helpful to know how many consumers consider you their preferred brand compared to your key competitors and other brand leaders in your industry.
The Usage Stage
The usage stage is when consumers transition from prospects to customers. Media channels employed at this stage include paid search, your website and organic social media. Since this is the step when the purchasing happens, your main KPIs to track will be the number of purchases made, appointments scheduled, etc., depending on your industry.
Purchase and sales data is readily available through your Customer Relationship Manager (CRM) or other backend tools, and it’s good to keep an eye on this internal data. Additionally, it can be helpful to occasionally have a broader, quantitative survey performed to help depict your company’s market share or, depending on your business, your share of wallet. Market share is the percent of a market controlled by one company. Share of wallet is how much a given customer spends with a brand relative to its competitors.
Together, tracking all these KPIs throughout the buyer’s journey should help you build a more complete picture of your advertising and marketing effectiveness and help you see which channels are making a difference and which need attention.
Are you ready to go back through your ad performance data with fresh eyes? Hopefully this gives you the tools to take a closer look and either affirm your decisions or help you more thoughtfully make new ones.
Want to readjust your marketing and advertising strategy? Reach out to our team to start a conversation about our strategic media planning services.